Viewing execution traces
This document describes SeeC's trace viewer, which is used to view execution trace files. An execution trace file is produced when executing a program that was compiled with seec-cc (for more information see Compiling and executing programs).
Note: if you have installed SeeC on your own machine running OS X, then seec-view is an Application. You should be able to open trace files simply using the open command (e.g. for a trace file called "uniqfs.seec" we would run open uniqfs.seec), or by double clicking on the trace file in Finder.
Note: the screenshots in this guide were taken on a Linux system, but the use and behaviour of SeeC should be identical on OS X or Windows.
Moving forwards and backwards
An execution trace contains a record of your program's execution. SeeC's trace viewer shows us a single state at any given time, but allows us to move both forwards (simulating the original execution) and backwards ("rewinding"). Basic movement is performed by the backwards and forwards arrows at the top of the trace viewer:
The trace viewer window
![]() Move backward to the beginning of the trace.
Move backward to the beginning of the trace.
![]() Move backward to the previously completed statement.
Move backward to the previously completed statement.
![]() Move backward a single step.
Move backward a single step.
![]() Move forward a single step.
Move forward a single step.
![]() Move forward to the next completed statement.
Move forward to the next completed statement.
![]() Move forward to the end of the trace.
Move forward to the end of the trace.
If a runtime error was detected during a program's execution then the process is terminated, thus the runtime error will be at the end of the trace. We can move forward to the end of the trace, examine the runtime error, and then move backwards to review the events that contributed to the error. The ability to move backwards is sometimes referred to as "reverse debugging".
The source code window
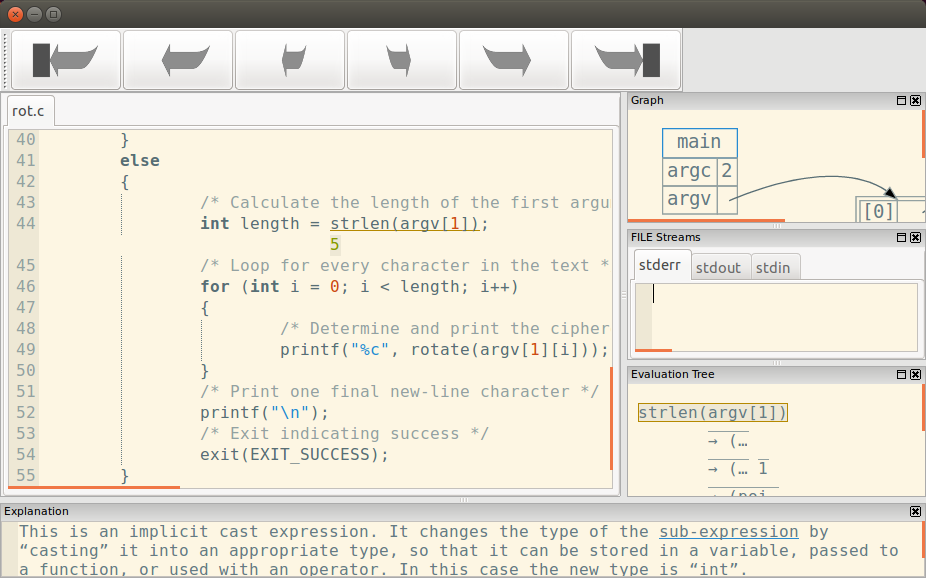
This window shows the source code of your program. Each source code file has its own tab: when the state is moved, the active source code file's tab is automatically selected, and the file is scrolled to show the currently active expression. The currently active expression is underlined by a yellow line. If the expression produced a value, then it will be shown beneath the expression.
Value produced by active expression
When you move the mouse cursor over the source code of your program, SeeC will highlight the statement or declaration that most precisely contains the character beneath your mouse cursor.
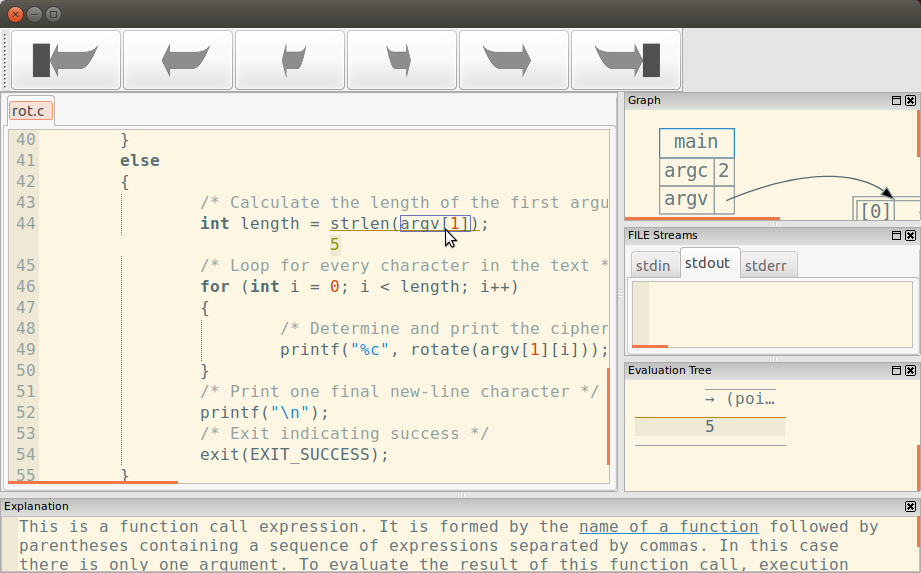
Highlight for statement under cursor
If a statement is highlighted then you can right click the mouse (or control click on OS X) to bring up a navigation menu that allows you to rewind to the previous time that this statement was completely executed, or to move forward to the next time that this statement was completely executed.
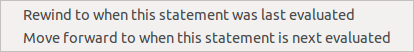
Navigation menu for statement
The explanation window
This window shows an explanation of the currently active expression. This currently active expression is highlighted in other windows in yellow (e.g. the source code window and the evaluation tree window). Note that the explanation refers only to the part of the expression that is currently active. For example, in the expression a + (b * c) if the + operator is active then the explanation will only refer to the + operator: the * operator would not be described. Moving forwards or backwards by single steps will change the active part of the expression, allowing you to view related explanations.
Explanation window
The explanation text may contain sections underlined in blue. These sections are interactive in some fashion: they might refer to a statement or declaration in the source code, in which case moving the mouse over them will cause the statement or declaration to be highlighted; or they might be a link to a webpage containing more information, in which case clicking on them will attempt to open the webpage in your default browser.
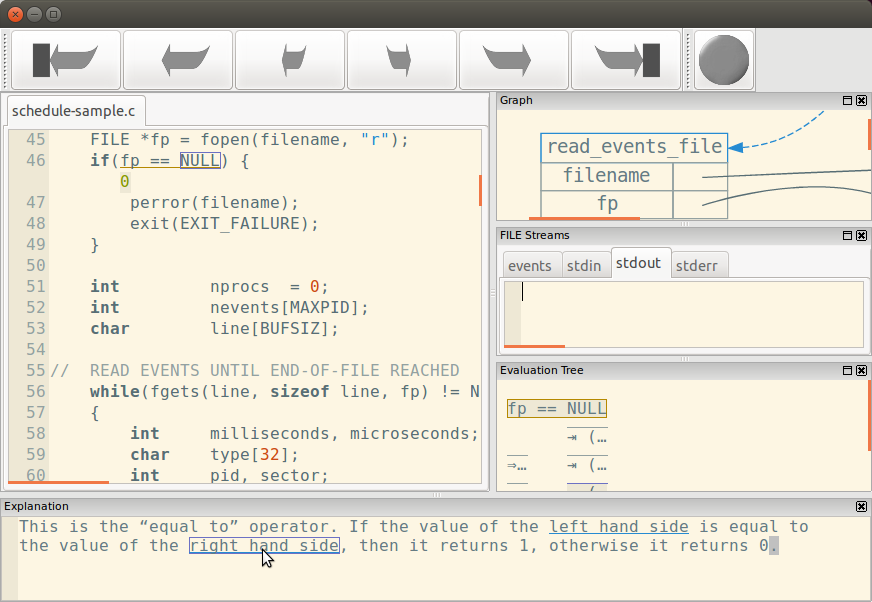
Highlight for expression referenced by text under cursor
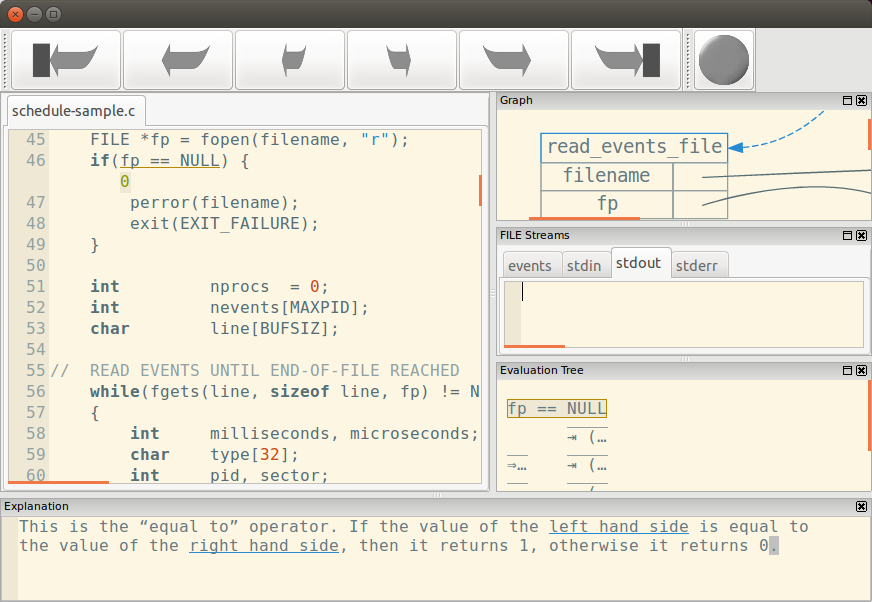
The graph window
The graph window shows a visualization of the program's memory state.
Note: on OS X the graph window does not correctly detect mouse hovering. As a workaround you can single left click on an element to highlight it.
Every active function call has a node in the graph. The top of the node is a blue rectangle containing the function's name. A dashed blue arrow links a calling function to its called function. A function node contains one row for each variable in the function's scope: the variable's name is in the left cell, and the variable's value is in the right cell. You can right click the mouse (or control click on OS X) on a function node's name to bring up a navigation menu for that function call, which allows you to rewind to the function call's entry or move forward until the function call is complete.
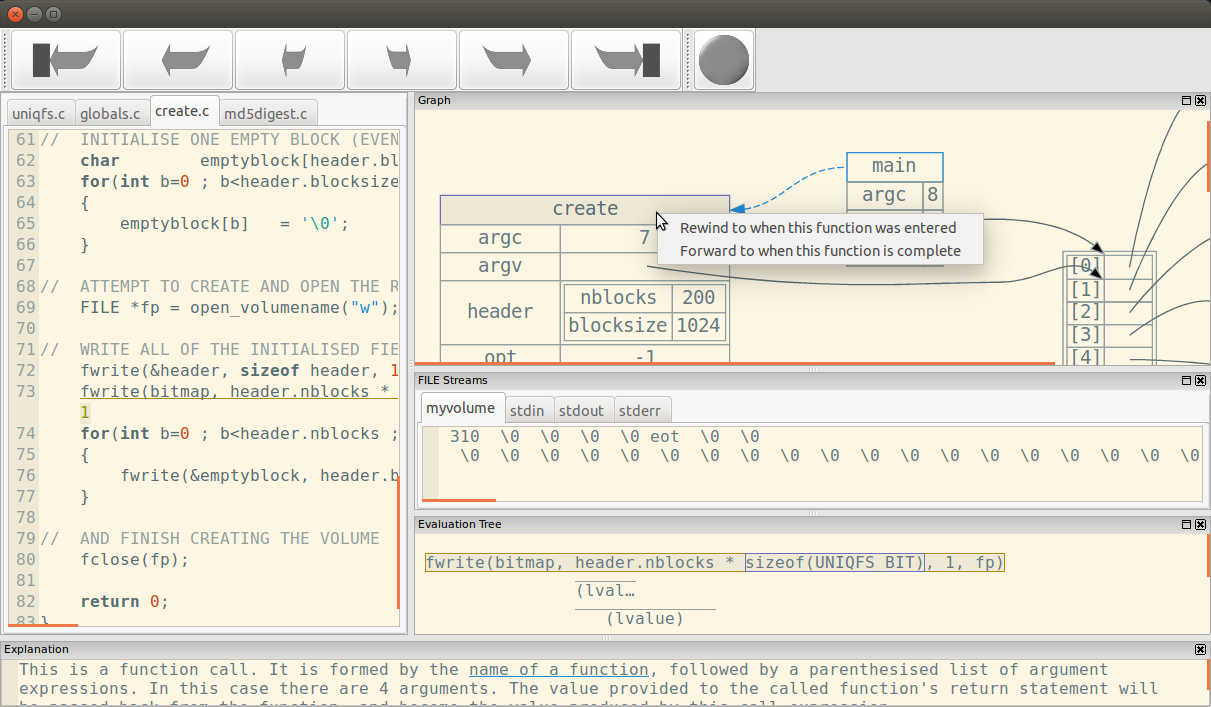
Navigation based on function
Statically allocated variables (with either global scope or function scope) are displayed in their own node, which simply has the variable name on the left and the variable's value on the right. If the variable is declared in a function then the function's name is shown as well, e.g. function_name :: variable_name.
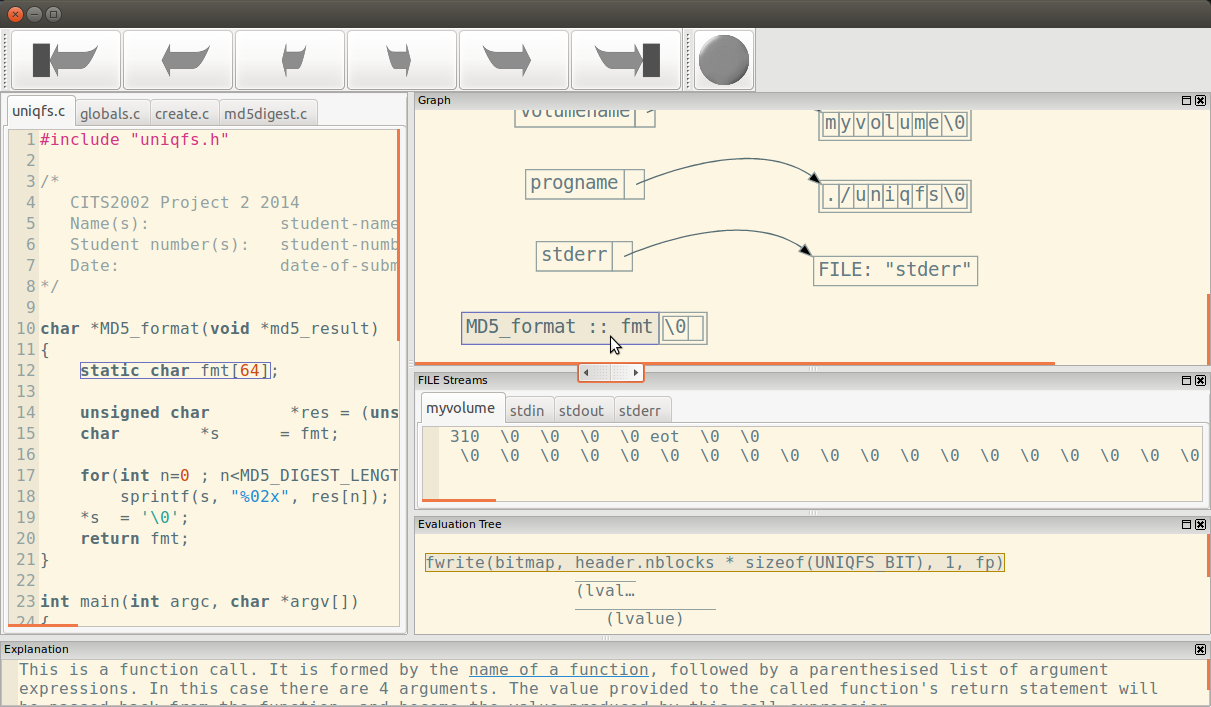
Static local variable
Primitive values, such as integers and floating point numbers, are simply represented by their current value (e.g. as we might expect if we were to print them using printf). If a value's memory is uninitialised, then no text will be shown and the value's cell will be grey.
Pointers are represented by an arrow from the pointer's location to the pointee (the memory that the pointer references).
Dynamic memory allocations are displayed in their own node. The values contained in these allocations are determined by the type of the pointers that reference the allocation. Memory that is statically allocated by the C standard library is also shown in this manner.
Dynamically allocated memory
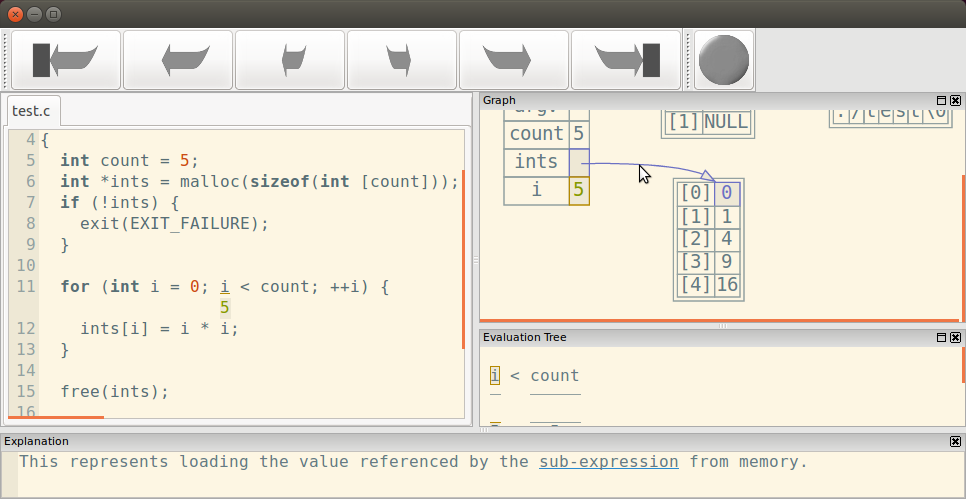
Arrays are represented by a table with indices on the left and the corresponding values on the right. SeeC typically elides elements that are uninitialized or have a zero value, to improve the visibility of large arrays that are only partially used. Arrays of chars are typically represented as a "C string": each char's value is shown horizontally, with no indices. You can change the display of a value by right clicking on the value's node and selecting the "Display as..." menu, which will give a list of possible display types. Note that if you force SeeC to completely display very large graphs (e.g. by not eliding large arrays) then the underlying graph generation software, Graphviz, may fail to produce a graph.
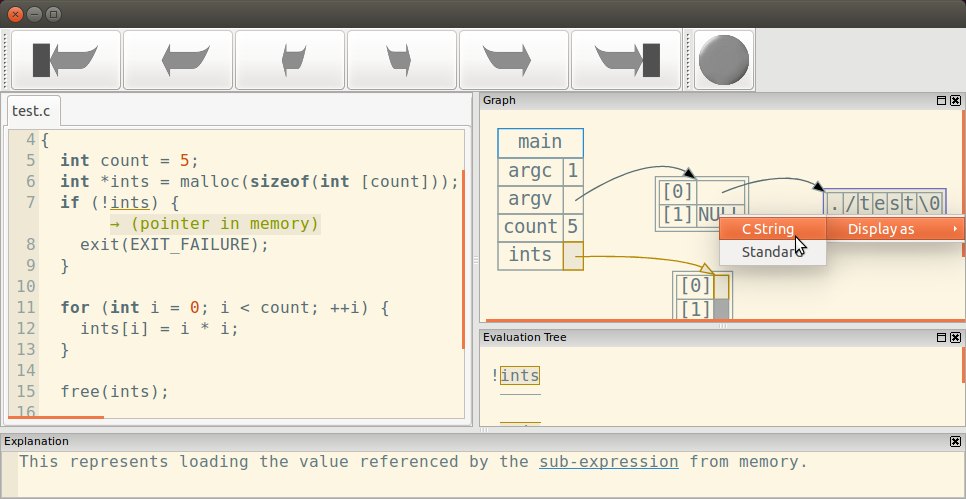
C string display
Structures are represented by a table with member names on the left and the corresponding values on the right.
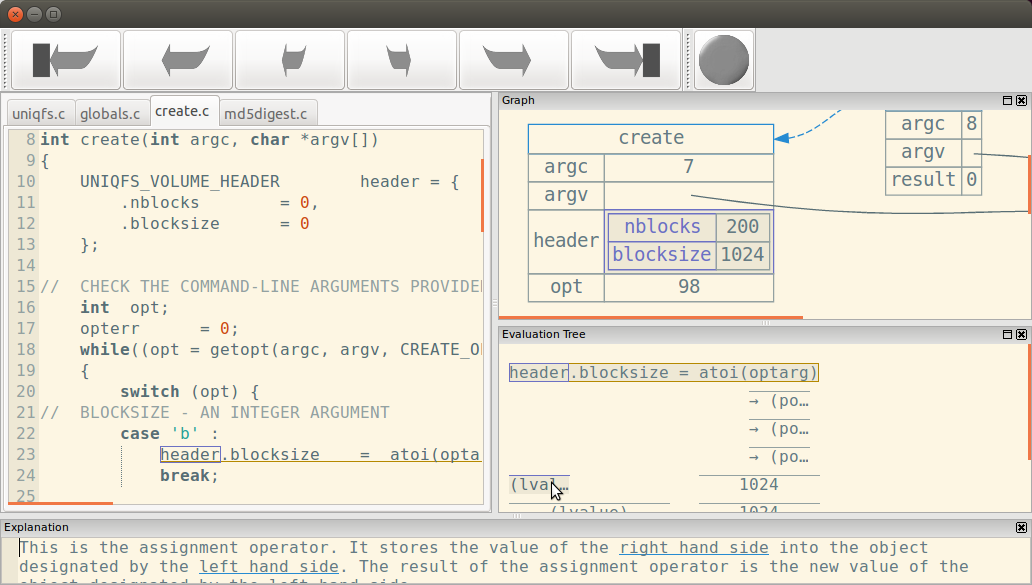
Structure display
You can right click the mouse (or control click on OS X) on any value or allocation to bring up a navigation menu that allows you to:
- Move backward to the point at which the memory was allocated (for statically allocated memory, this will be the beginning of the trace).
- Move backward to the most recent time that the memory's value was changed.
- Move forward to the next time that the memory's value was changed.
- Move forward to the point at which the memory was deallocated (if the memory was never deallocated, this will be the end of the trace).
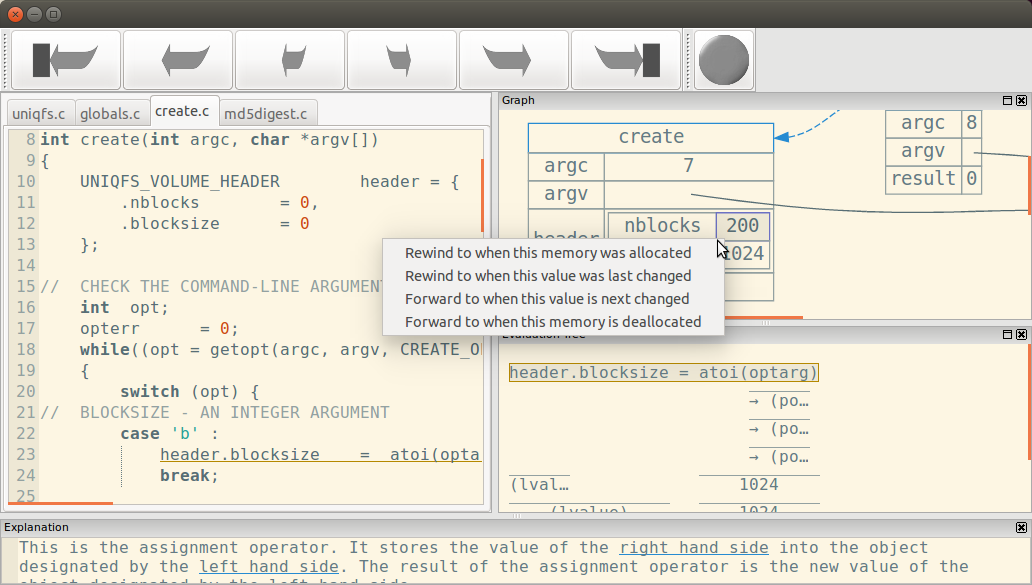
Navigation based on memory
The evaluation tree window
The evaluation tree shows the evaluation of the current statement. The statement's source code is shown in a single line at the top of the evaluation tree.
Evaluation window
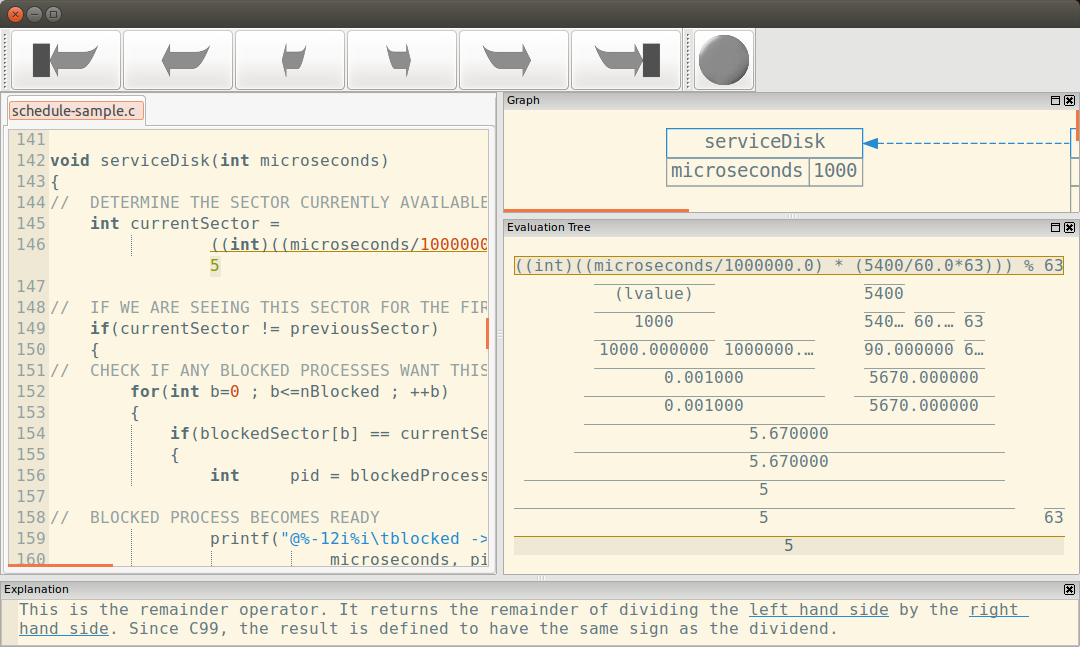
Any macros defined in your own code are expanded (macros defined in system headers are not expanded). In the following image we can see that the SECTORS_PER_SEC macro has expanded to the highlighted section of the evaluation tree (the node with value 5670.0, and all nodes directly above it).
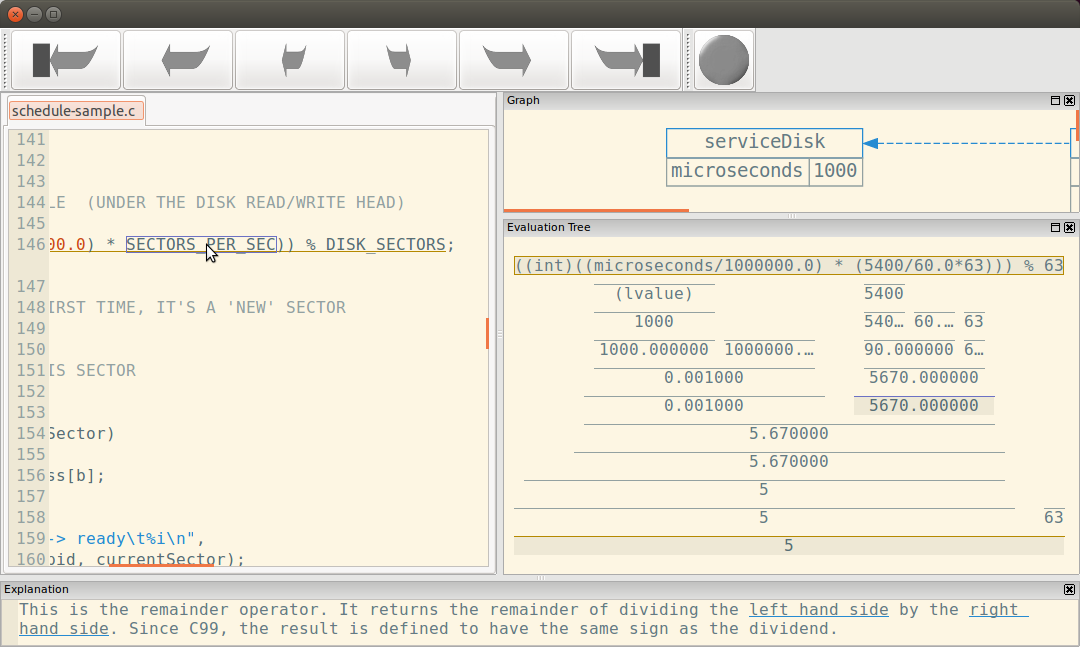
Macros expanded
Each part of the expression's evaluation is shown by a node in the tree. For example, if we had an expression 3 + 5 there are three parts: the value 3, the value 5, and the + operator adding the two values together. If a value's text is too large to fit into the node then an ellipsis will be shown. In the following image we can see that a division expression's node is highlighted; the nodes directly above it represent the operands to the division operator.
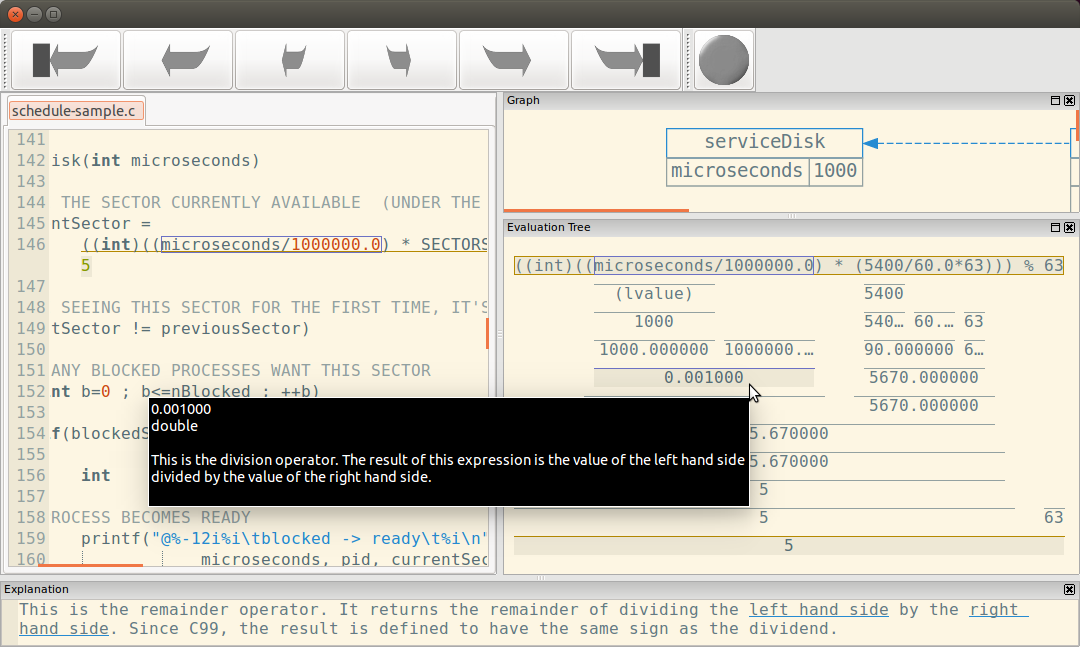
Node highlighted with tooltip
If you move the mouse cursor over a node then the corresponding source code will be highlighted (both in the evaluation tree window and the source code window). If you hover the mouse cursor then a tooltip will appear with more information (as we can see in the above image):
- The value produced by the operation.
- The type of value produced by the operation.
- An explanation of the operation.
- An explanation for any runtime error caused by the operation (in this case there are none).
You can right click (or control click on OS X) on a node to open a navigation menu containing the same movement options as if you had opened a navigation menu on the corresponding statement in the source code window.
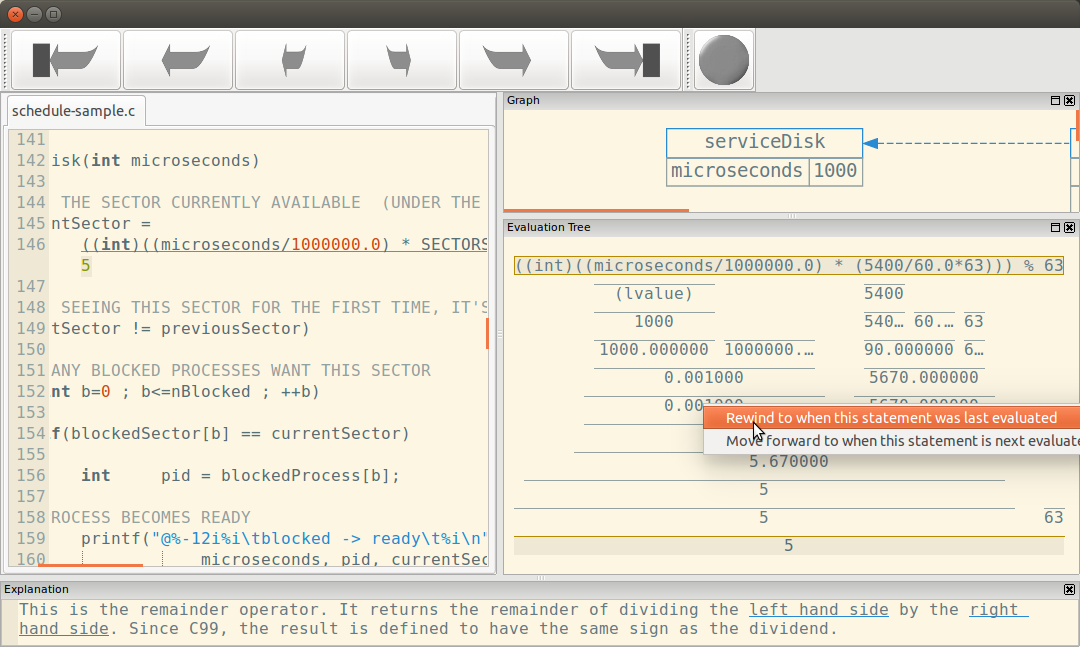
Navigation menu
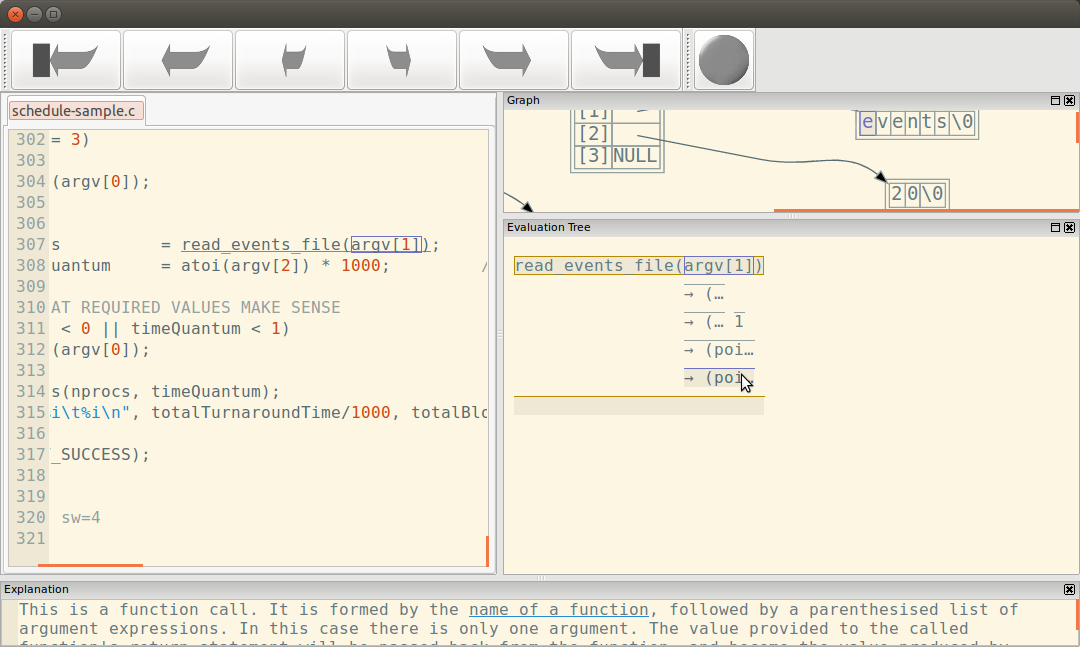
Some nodes refer to a value in memory. These are represented by the text (lvalue). Moving your mouse cursor over these nodes will cause the corresponding value to be highlighted in the graph window. The navigation menu for an (lvalue) node also contains movement options as if you had opened the navigation menu on the corresponding value in the graph window.
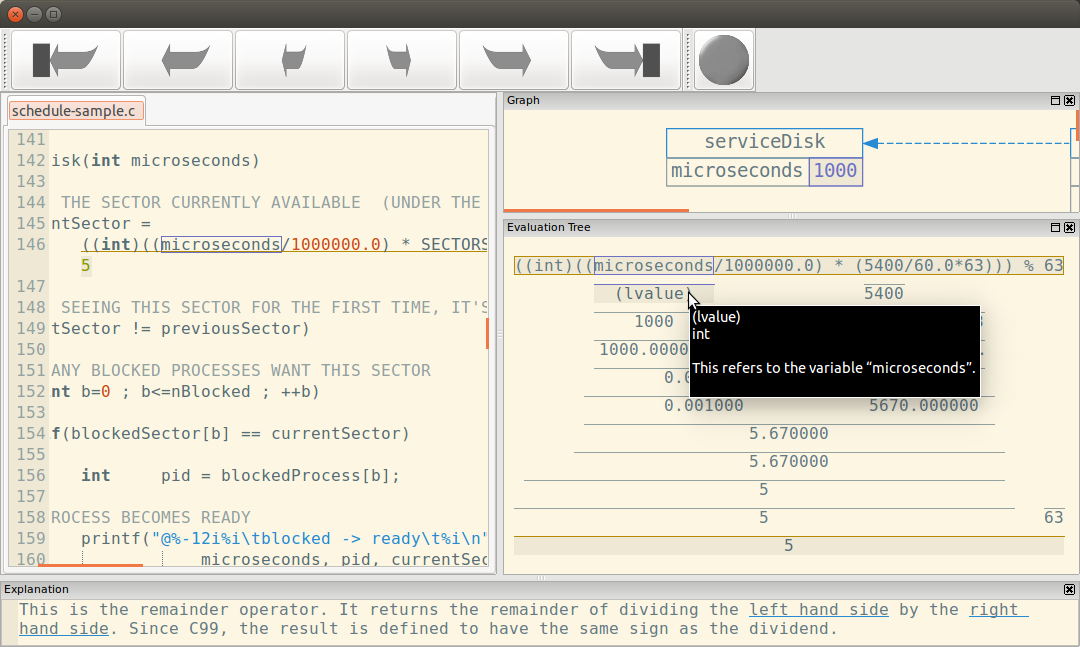
Value in memory highlighted in graph window
If a node's value is a pointer then the node will show descriptive placeholder text rather than the pointer's value. Moving your mouse cursor over these nodes will cause the referenced object to be highlighted in the graph window.
Pointee value highlighted in graph window
The FILE streams window
This windows shows data that the program has written to FILE streams, including stdout and stderr. You can move the mouse cursor over the text to see individual writes (the write that contains the text under the mouse cursor will be surrounded by a magenta rectangle). If you right-click on some text then you will be given the option to rewind to the point at which that text was written. Thus if you observe some output that appears to be faulty, you can quickly rewind the execution trace to the point at which that output was produced.
If any write to a stream contains non-ASCII values then all writes to the stream will be displayed as "raw data". In this case each individual write to the stream occupies a single line in the display. Each byte is shown as an ASCII representation of its value if one exists, or as the octal representation of its value. This is shown for the "myvolume" stream in the below image.
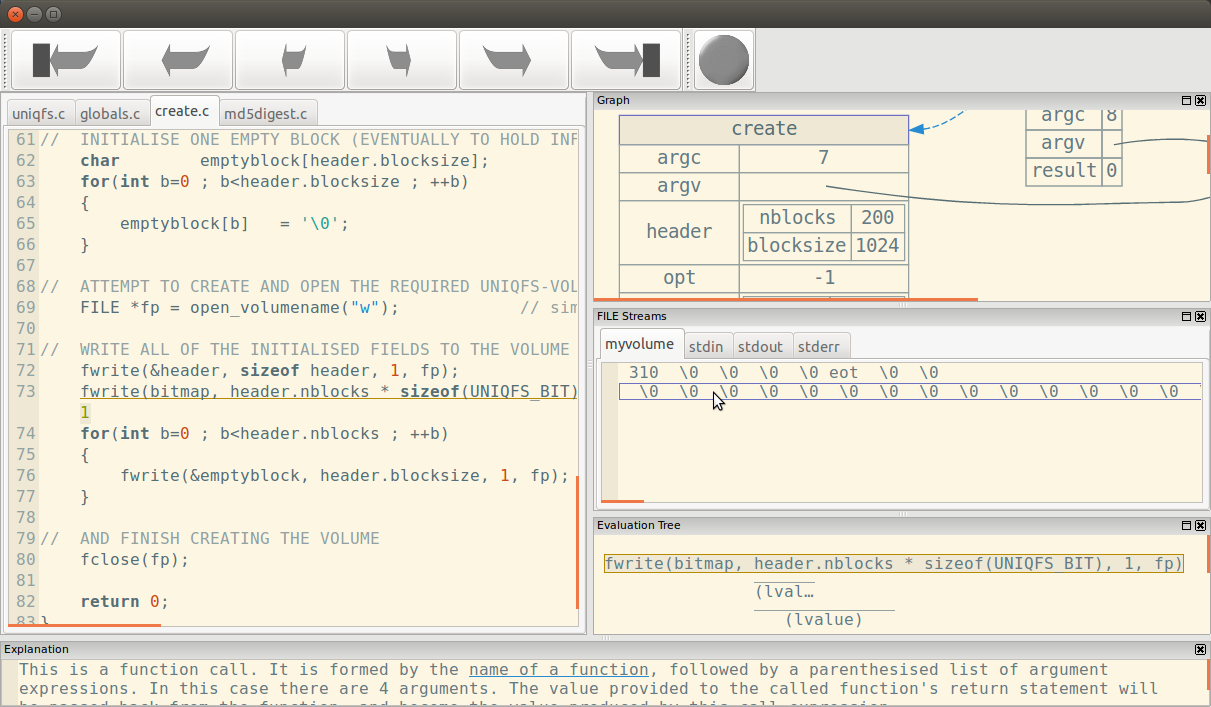
Mixed ASCII and Octal representation of file writes
Note: SeeC will not record movement of a FILE pointer (e.g. using fseek), so the stream representation does not show where data was written to in the file, rather it shows the data of each write in the order that the writes were performed.